Fio Benchmarking Graphs
Just some sample fio benchmark job results graphs generated using fio2gnuplot tool. I did some minor editing of the generated gnuplot files to better match the autogenerated graphs to meet my needs.
To generate the graphs:
- I ran
fiousing my Sequential Read 1024K block size profilerbb.fiofirst against/mnt/dasd3where a RAID 5 set of hard disk drives is mounted and then against/mnt/dasd4/where RAID 0 solid state drive is mounted. This generated the necessary log files. - Initially I ran
fio2gnuplot -b -gin the directory where the log files were to generate the bandwidth graphs, andfio2gnuplot -i -gto generate the IOPS graphs. The output was okay, but I decided would look better to me with some tweaking of the output. - I deleted the generated graph output files and then ran just
fio2gnuplot -bandfio2gnuplot -ito generate the gnuplot command files needed to generate the graphs. - I used a text editor to modify the gnuplot command files:
- I created multi-line titles, adding tested drive RAID type and blocksize.
- Moved legend to bottom right.
- Adjusted y-axis range to decrease amount of unbalanced whitespace above and blow the plots.
- Lastly I ran
gnuplotusing the edited command files to generate the graphs, samples of which can be found below.
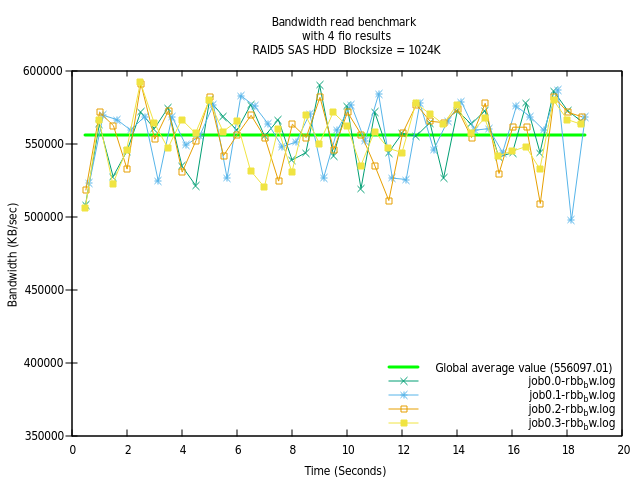
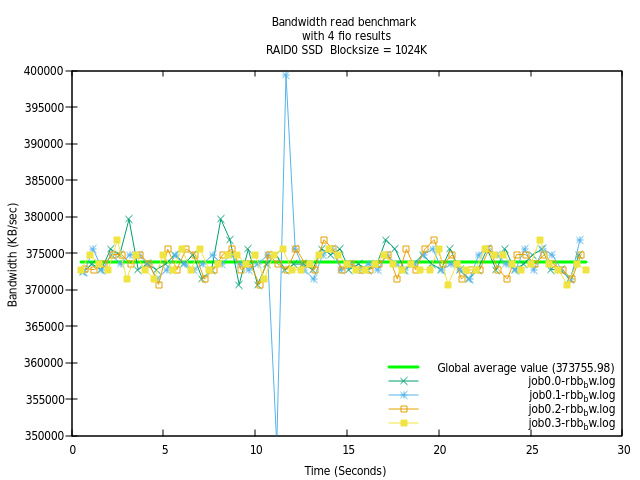
Sequential Read Bandwidth Graphs
Spinning Disk RAID5
Solid State Disk RAID0
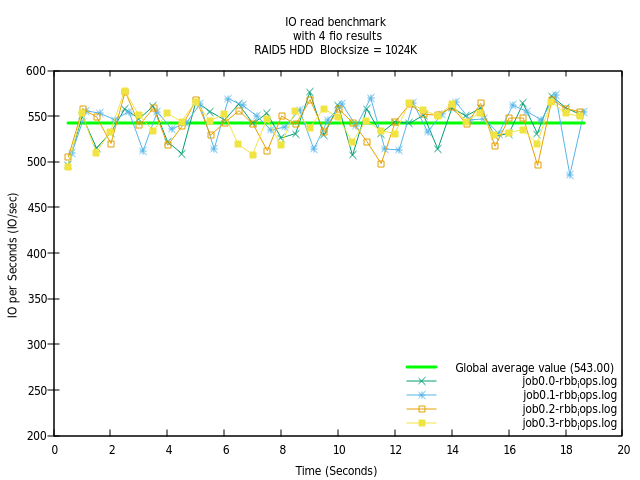
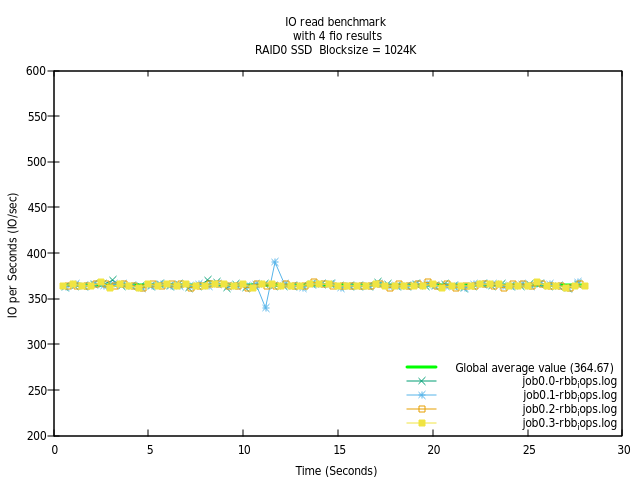
Sequential Read IOPS Graphs
Spinning Disk RAID5
Solid State Disk RAID0

Chrls is currently a technology transformation leader at one of the oldest American investment banking services holding companies, headquartered in New York City. Previous roles at current employer include project manager, front office support, retail and enterprise global Windows server support. Currently residing in Tennessee on the Cumberland Plateau and enjoying life, family and open source.
Mastodon Diaspora Funkwhale Pixelfed